Why Do eCommerce Teams Struggle Despite Having Data?
It’s Monday morning.
Your dashboards show healthy traffic. Pricing looks competitive. Availability seems stable. Yet sales dip, and three teams arrive at three different explanations.
This isn’t a data shortage. It’s an operating gap.
Most brands monitor marketplace performance continuously, but few run a weekly decision system that connects visibility, competitiveness, and conversion readiness into one view. Without that rhythm, insights remain fragmented, ownership stays unclear, and optimization becomes reactive.

High-performing brands solve this differently. They don’t just track metrics, they run a Digital Shelf Scorecard that translates signals into actions every week.
What Is a Digital Shelf Scorecard, And How Is It Different From a Dashboard?
A digital shelf scorecard is not another analytics report. It is a weekly operating system for marketplace performance.
While dashboards monitor data in real time, a scorecard organizes the signals that matter most, benchmarks them against competition, and links them to accountability. It answers three critical questions every week:
- What changed?
- Why did it change?
- Who acts on it?
This distinction matters. Digital shelf analytics explains performance. A digital shelf scorecard operationalizes it.
Instead of viewing hundreds of metrics in isolation, brands evaluate structured indicators of shelf health, discoverability, competitiveness, and conversion readiness, within a consistent decision cadence.
That cadence is what transforms monitoring into management.
Which Metrics Actually Define Digital Shelf Health?
Not all marketplace metrics drive outcomes. A digital shelf scorecard focuses on performance drivers, metrics that directly influence whether your product is found, preferred, and purchased.
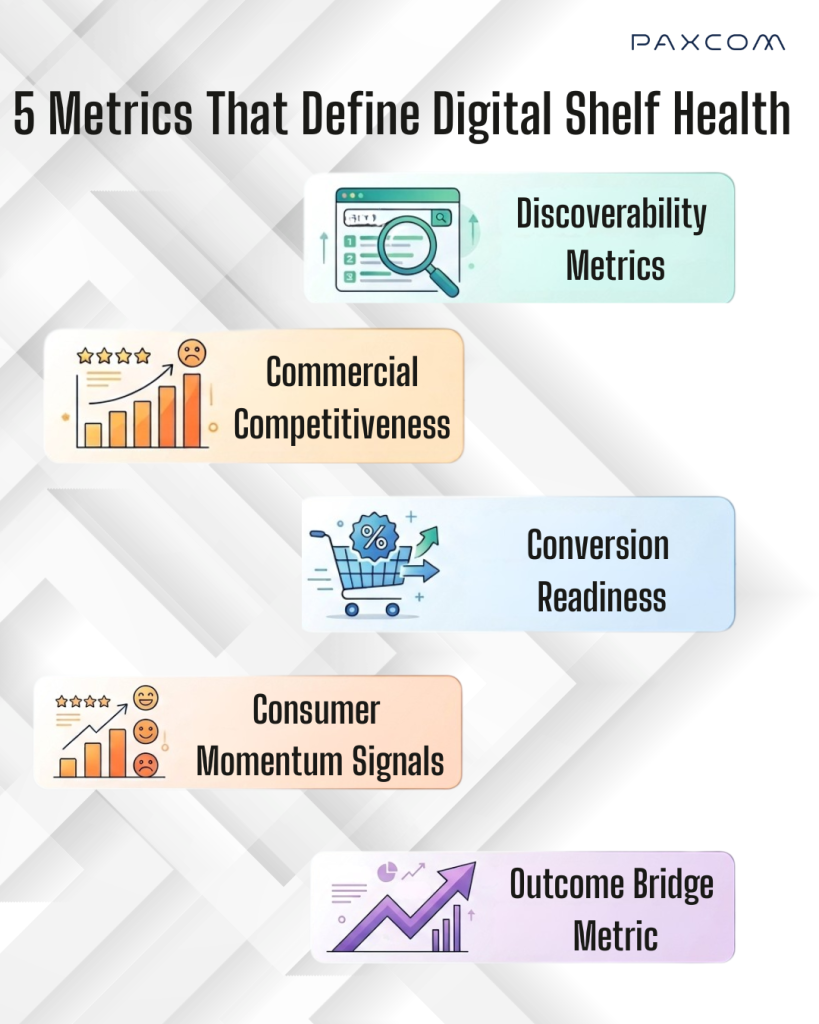
- Discoverability Metrics
Example: Your product is live, but doesn’t appear when shoppers search for it.
Discoverability defines whether your product even enters the consideration set.
- Share of Search: Measures how frequently your product appears for high-intent keywords compared to competitors. A low share means you’re invisible where demand already exists.
- Category Visibility Rank: Tracks your product’s position across category listings or search results. Higher ranking directly improves click probability and discovery.
- Content Completeness: Evaluates how well your listing is optimized (titles, images, attributes, keywords). Poor content limits both organic visibility and ad performance.
- Commercial Competitiveness
Example: Your product shows up but loses to a better-priced or better-packaged competitor.
Once visible, your offer must compete.
- Price Index: Benchmarks your pricing against similar products. Even slight deviations can shift conversion in price-sensitive categories.
- Promotion Intensity: Captures the depth and frequency of discounts or deals. Strong promotions can temporarily boost both visibility and conversions.
- Buy Box Ownership: Indicates whether your product is the default purchase option. Losing this often means losing conversions, even with high visibility.
- Conversion Readiness
Example: Customers are ready to buy, but something breaks the journey.
This layer determines whether demand converts into sales.
- Availability Rate: Measures how consistently your product stays in stock. Even short outages can lead to significant revenue loss.
- Stock Stability: Tracks how frequently inventory fluctuates. Unstable supply disrupts both organic ranking and ad efficiency.
- Rating Score: Reflects customer trust. Lower ratings can directly impact conversion, especially in competitive categories.
- Consumer Momentum Signals
Example: Your product is selling, but not building long-term preference.
Sustained growth depends on consumer validation.
- Review Velocity: Tracks how quickly new reviews are being generated. Higher velocity often signals stronger demand and engagement.
- Review Sentiment Trend: Goes beyond ratings to analyze whether feedback is improving or declining, early signals of product or experience issues.
- Outcome Bridge Metric: Are Your Efforts Driving Sales?
Example: Your product gets visibility, but sales don’t scale proportionately.
- Visibility-to-Sales Efficiency: Measures how effectively your visibility (impressions, rankings, share of search) translates into actual sales.
How to use it:
- If visibility is high but sales are low → the issue likely lies in pricing, content, or ratings
- If both visibility and sales are low → the problem is discoverability
- If sales are strong with low visibility → there’s an opportunity to scale through ads or content
This metric acts as a diagnostic bridge, connecting what customers see with what they actually buy.
A Quick Guide To Digital Shelf OptimizationHow Do You Distinguish Meaningful Signals From Noise?
Marketplace metrics fluctuate constantly. Not every change requires intervention.
Leading brands evaluate shelf health using three principles:
- Benchmark, don’t isolate.
Performance only makes sense relative to category norms and competitor movement. - Trend, don’t snapshot.
Sustained deviation matters more than daily variation. - Act on impact, not activity.
Prioritize signals that affect discoverability, competitiveness, or conversion readiness.
A structured scorecard filters noise automatically, allowing teams to focus on decision-relevant signals rather than data volume.
Who Owns Digital Shelf Performance Inside an Organization?
One of the biggest barriers to marketplace growth is unclear ownership. Metrics often exist without accountability, leading to fragmented responses and delayed action.
A digital shelf scorecard resolves this by aligning metrics to decision owners.
Brand Teams typically own:
- Content completeness
- Ratings and review health
- Visibility quality
Sales or Marketplace Teams typically own:
- Price competitiveness
- Promotional strategy
- Share of search performance
Operations or Supply Chain Teams typically own:
- Availability
- Stock stability
- Seller health
This ownership structure transforms analytics into execution.
Metrics without ownership rarely drive growth.
What Does a Weekly Digital Shelf Scorecard Look Like in Practice?
A digital shelf scorecard is designed for decision-making, not reporting.
A typical weekly view includes:
- Metric health status (Green / Amber / Red)
- Week-on-week performance trend
- Category benchmark comparison
- Assigned decision owner
- Recommended action
Rather than presenting raw data, the scorecard provides a performance narrative: where risk is emerging, where opportunity exists, and where intervention is required.
This structure enables governance. It allows leadership to review marketplace performance consistently and respond with clarity.
If you would like to see a real-world example, you can request a Digital Shelf Scorecard sample for your category.
Why Do Leading Brands Treat the Digital Shelf as an Operating System?
Marketplace growth is rarely driven by isolated campaigns. It is driven by operational discipline.
When shelf performance is reviewed weekly through a structured scorecard, several shifts occur:
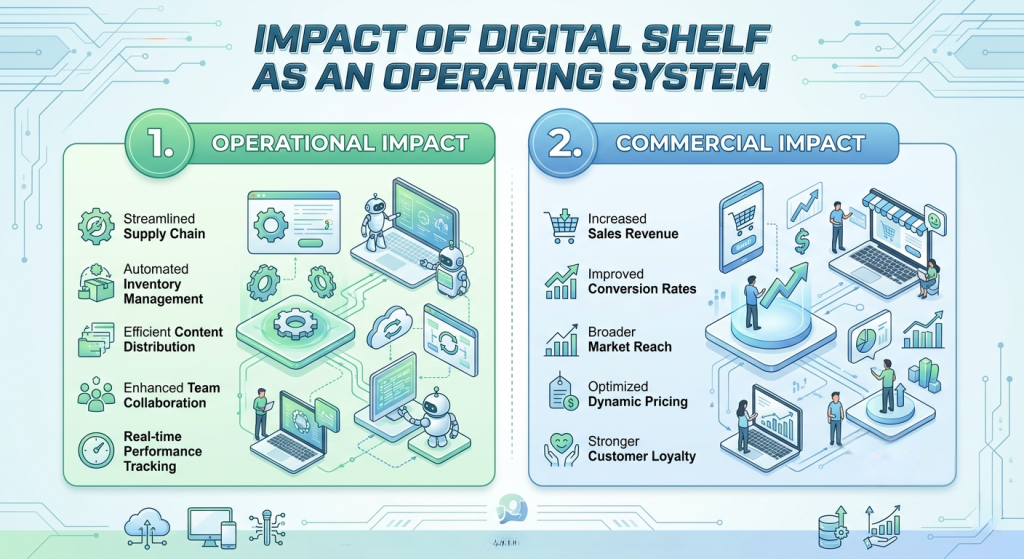
Operational Impact
- Issues identified early, not after revenue loss
- Weekly cadence replaces ad-hoc firefighting
- Clear ownership across teams
Commercial Impact
- More consistent conversions
- Better alignment between pricing, availability, and demand
- Stronger competitive positioning
The advantage is not just visibility, it’s acting before it’s too late.
What gets reviewed weekly gets improved consistently.
How Does a Digital Shelf Scorecard Improve Retail Media Efficiency?
Retail media is one of the fastest-growing investments in eCommerce, but also one of the least efficiently utilized.
Most brands optimize ads in isolation:
- Increasing bids when sales drop
- Scaling spend on high-traffic keywords
- Measuring performance primarily through ROAS
But this approach ignores a critical reality:
Ad performance is directly influenced by digital shelf conditions. This is where a digital shelf scorecard becomes critical.
It connects organic shelf health with paid media decisions, enabling teams to:
- Identify when low ROAS is a media problem vs a shelf problem
- Pause or optimize spend on products with poor conversion readiness
- Prioritize ad investment on high-performing, well-positioned SKUs
- Align media strategy with real-time shelf conditions
Instead of asking “Should we spend more?”, teams start asking “Is this product ready to convert?”
That shift improves not just efficiency, but decision quality.
How Can Brands Transition From Monitoring to Management?
Moving from dashboards to a scorecard-driven model does not require more data. It requires structure.
Leading organizations typically follow a simple transition path:
- Define a core set of digital shelf metrics
- Assign ownership across brand, sales, and operations
- Establish a weekly review cadence
- Benchmark performance against category norms
- Act systematically on sustained deviations
This transforms marketplace analytics from passive tracking into a weekly decision system, where insights are consistently translated into actions.
It also creates a closed-loop execution model:
- Metrics highlight issues
- Teams take action
- Performance is reviewed again the following week
No gaps. No delays. No missed signals.
What Happens When Shelf Performance Becomes Operational?
Marketplaces reward discipline.Brands that win do not simply monitor performance, they manage it systematically.
Without a structured system, most brands operate reactively, responding to problems only after they’ve impacted performance.
- Reactive = Discovering a pricing gap on Friday, after losing a week of conversions.
- Proactive = Catching it on Monday through a Green/Amber/Red scorecard flag and fixing it before impact scales
This is the shift a digital shelf scorecard enables.
Digital shelf analytics tells you what happened. A digital shelf scorecard tells you what to do next.
If you want to evaluate how your brand performs across the metrics that matter most, you can request a Digital Shelf Scorecard sample and benchmark your marketplace performance today.