In the ever-expanding landscape of online shopping, businesses find themselves grappling/struggling with an abundance of data. However, using this data to extract meaningful insights is the true challenge. This is where the pivotal role of data visualization comes into focus.
Think of data visualization as a guide for navigating users and decision-makers through the complexities of online transactions. In this blog, we’ll take a stroll through the e-commerce cityscape, exploring how data visualization acts as a traffic controller, and steering insights to empower decision-makers, improve user experiences, and prevent businesses from getting stuck in the digital traffic jam.
Challenges of big Data Visualization
The challenge with e-commerce data lies in the vast volume that can be collected and analyzed for your online store. Whether it’s data related to marketing, website engagement, sales, or logistics, digital tools and platforms offer immediate access to a wealth of information.
While, in theory, such an extensive dataset should simplify the process of uncovering valuable ecommerce insights and trends to enhance your store’s performance, the reality often differs. The sheer magnitude of available data poses a complexity to e-commerce analytics, leading to its frequent neglect by Brand owners and managers.
Data visualization is the Answer!
The solution is not to overlook your data but rather to gain a better understanding by transforming that data into visually appealing reports. Visualizing e-commerce data is a significantly more effective and efficient method for analyzing your brand’s performance.
Using charts, graphs, shapes, and other visual elements, data visualization takes mundane text, which may take hours to comprehend, and transforms it into engaging ecommerce insights that can be absorbed in mere seconds.
What is Data Visualization?
Data visualization in ecommerce is the practice of presenting ecommerce data in visual formats such as charts, graphs, or maps. It allows businesses to quickly interpret complex data sets, identify patterns, and make informed decisions. In ecommerce, data visualization is crucial for understanding customer behavior, sales trends, inventory management, and more. It helps improve sales strategies, customer relationships, and the overall shopping experience. Some of the types of ecommerce data that can be visualized include sales data, competitor analysis, website analytics, and customer acquisition channels.
Significance of Data Visualization in ecommerce-
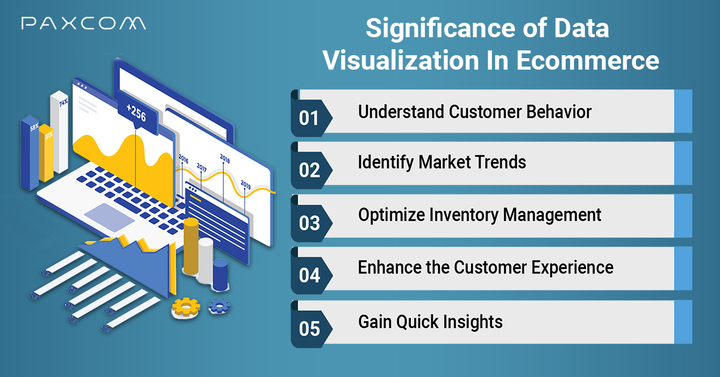
Data visualization is a crucial aspect of modern data science, as it helps people see, interact with, and better understand data. It is essential for various careers, including teachers, computer scientists, and business analysts, to make data easier for the human brain to understand and pull insights from. The significance of data visualization can be summarized as follows:
- Understand customer behavior: By visualizing customer data encompassing purchase patterns, browsing histories, and demographics, businesses gain a deeper understanding of their customers’ desires and inclinations. This knowledge helps fine-tune a successful marketing strategy, personalize customer experiences, and ultimately boost sales.
- Identify market trends: Data visualization allows real-time analysis of market trends and customer demands. By visually rendering sales data, businesses can pinpoint popular products, identify market gaps, and foresee emerging trends, optimizing their product offerings and staying ahead of competitors.
- Optimize inventory management: Through data visualization, businesses keep tabs on inventory levels, monitor stock availability, and flag potential supply chain bottlenecks. Visualizing data related to stock levels, lead times, and reorder points streamlines inventory management, prevents stockouts, and reduces carrying costs.
- Enhance the customer experience: Visualizing data tied to customer feedback, product reviews, and customer support interactions allows businesses to spot pain points in the customer journey. With this insight, you can refine the customer experience, elevate satisfaction, and foster customer loyalty.
- Gain quick insights: The e-commerce landscape is fiercely competitive, with the industry experiencing rapid growth, leading to intensified competition. In this dynamic market, e-commerce companies cannot afford to miss any opportunities. Data visualization proves valuable in this context, enabling companies to swiftly grasp crucial elements like the quality of customer experience and customers’ navigation history on the website. These insights serve as a foundation for developing a robust business strategy.
Visualizing Success: Key types of eCommerce data for sellers
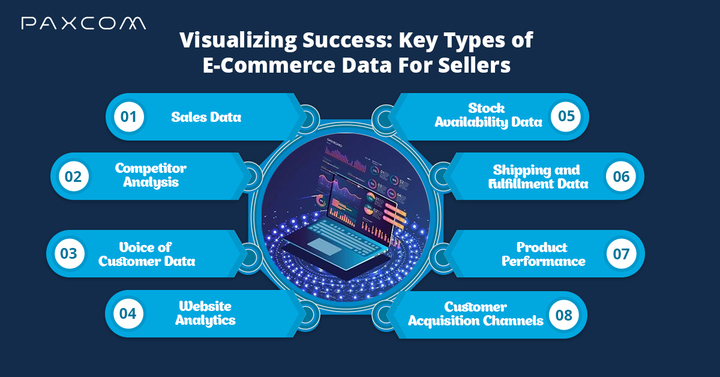
- Sales Data: Identifying trends, seasonality, and performance of different products or categories.
- Competitor Analysis: Provide ecommerce insights into market positioning, pricing strategies, and product assortment comparisons.
- Voice of Customer Data: Visualizing customer feedback, reviews, and sentiment analysis to understand customer preferences and improve satisfaction.
- Website Analytics: Visualizing website traffic, user behavior, and conversion funnels can help optimize the online shopping experience.
- Stock Availability Data: Visualizing stock levels and inventory turnover can aid in inventory management and avoiding stockouts.
- Shipping and Fulfillment Data: Visualizing shipping times, order fulfillment rates, and customer delivery experiences.
- Product Performance: Visualizing product metrics such as return rates, customer ratings, and sales velocity can guide product assortment decisions.
- Customer Acquisition Channels: Visualizing the performance of different marketing channels can help allocate resources effectively.
Unlocking business insights with Summation 360: A Data Visualization Powerhouse
Summation 360, our cutting-edge data visualization tool, is crucial in empowering brands with actionable insights for strategic decision-making. Designed for intuitive use, Summation 360 is the key to navigating the complexities of data effortlessly, revolutionizing the approach to analytics.
Key Features:
- Easy Data Integration: Summation 360 simplifies the process of integrating diverse datasets, ensuring seamless access to comprehensive information.
- Customizable Visualizations: Tailor visualizations to your specific needs, providing a personalized and insightful view of your data.
- Powerful Analytics: Leverage robust analytics tools within Summation 360 to delve deep into data, extracting valuable insights that drive informed decision-making.
- Customized Processes: Adapt Summation 360 to fit your unique business processes, enhancing its effectiveness for your specific requirements.
- Simple to Advanced Operation: With just a few clicks, transition seamlessly between basic and advanced operations, making data manipulation and analysis accessible to users at all levels.
- Daily Updates: Stay abreast of real-time changes with daily updates, ensuring that your insights are based on the latest data.
- KPI Tracking: Summation 360 facilitates easy tracking of Key Performance Indicators (KPIs), providing a clear overview of your business metrics.
- Collaborative Environment: Foster collaboration among teams by utilizing Summation 360 collaborative features, allowing multiple stakeholders to contribute to data interpretation and decision-making.
Summation 360 transforms the data visualization landscape, offering a user-friendly and powerful platform that aligns with the dynamic needs of businesses. Effortlessly unravel the potential of your data and elevate your approach to analytics. Connect with us- info@paxcom.net