Data analytics has been around for a long time now. It’s been helping people and companies make more intelligent decisions for many years. But now, the availability of consumer data is a game-changer. The new age of retail is pushing brands to invest in data analytics. It’s the only way to keep up with the fast-paced world of retail and the needs of a sophisticated shopper.
If you are a novice to data analysis, it can be a bit overwhelming. It is for that reason that we are here to explain how data analytics works. Data analytics aims to analyze a company’s data to find meaningful insights that lead to better decision-making. When businesses leverage their data holistically, they can make more informed decisions, increase profits, attract more customers, and optimize their processes. In an e-commerce business, data analysis can help you gain insights into customer behavior and then use that information to guide your marketing and product development efforts.
Nowadays, eCommerce platforms provide an opportunity for multiple brands and sellers to sell the same thing, which increases competitiveness. You can, for example, find a mop brush on Amazon that multiple sellers are selling. Data can give you insight into why some products perform well and convert well, and others don’t; it can also allow you to discover potential pitfalls you should address and areas where your competitors are outperforming you.
With the advent of e-commerce, there is a lot of data available for businesses, but there are also challenges. How do you use this data to make your brand better? How does it help you make decisions? Let’s take a look at how it helps in contributing towards eCommerce growth.
Table of Contents
How to Analyze Your Data?
One of the first steps that brands should take when getting started with e-commerce analytics is to figure out which metrics are essential. Generally, analytics experts recommend the segmentation of the data so that you can see how your performance has changed over time.
Analyzing your sales and performance data can be an uphill task; a channel intelligence solution helps you automate this process. For example, in the dashboard, you can see how its data is packaged to enable Price MAP variation mapping, Category visibility, Best seller share, etc., and generate reports that can be utilized to devise a strategy to improve your business ultimately. You can use data to create, eliminate, or focus marketing activities on the most relevant target audience.
Why should brands take leverage of channel intelligence solutions to improve their performance on eCommerce platforms?
Not all e-commerce brands are able to gather, process, and use data to identify opportunities and assess the size and scope of opportunities for their business. Channel intelligence solution brings structured data on the consumer purchase behaviors to help you identify the various KPI metrics, improving sales performance. Analytical insights have become the must need for every brand/seller to stay ahead in this cut-throat competitive environment.
Let’s take a look at the different avenues of data analytics that can help you to increase sales;
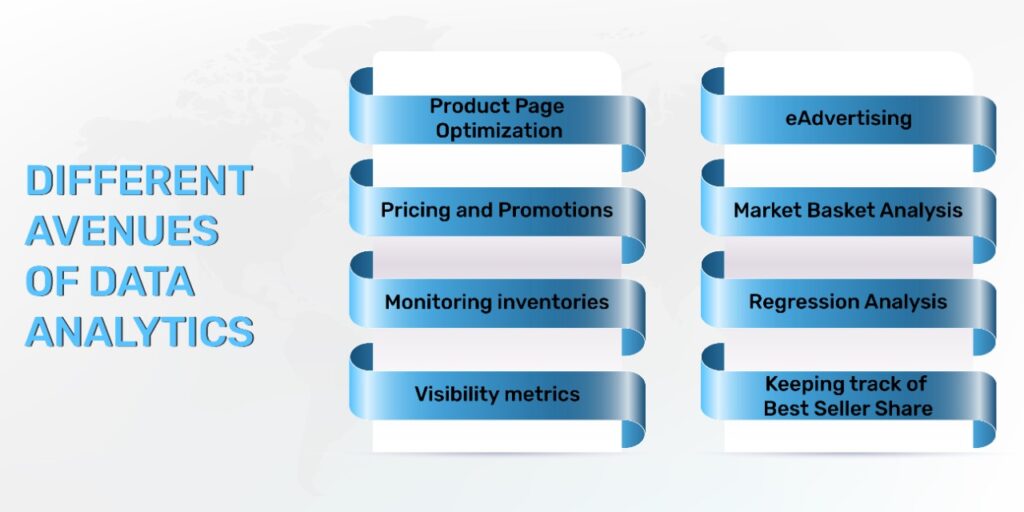
Product page optimization
Product page optimization is a little-known art; though all the product pages should be optimized, very few are. This is where customers get to interact with your brand, but if they are not performing well? What would you do?
Data can help you figure out by crawling all the data at once, and you can analyze where you are falling short, it assists in identifying whether the product title doesn’t have the relevant keywords, whether the images are mobile-optimized or not, and whether your product feed contains all the content or not? Performing regular content audits is important to identify quickly, compare, and address product display page content shortcomings. You can use it to generate scorecards that show if your product information is correct and complete to improve discoverability and buyability and to identify gaps that should be closed.
With the right tools and information, you can see what changes need to be made to optimize your product listing and ensure that every detail is considered.
Price and Promotion optimization
Almost 60% of consumers consider price to be the deciding factor when it comes to making a purchase (ETbrand equity). So, you know how important it is to strike a balance between your price and keeping customers happy so that they keep coming back to you.
Price optimization basically utilizes data points that include historical sales data, operation costs, and SKU’s. With analytics tools, you can identify the bigger picture and monitor the competitor pricing as well. You can also track the pricing pattern of authorized and unauthorized sellers, and This data helps ensure a controlled pricing & promotion strategy and help close loops.
Discounts and promotions are proven methods for boosting sales. IOS reports state that shoppers make the most of their purchases when any sorts of promotions are ongoing. But what most e-commerce retailers know is that discounting products is not as simple as it sounds – you need to track your promotions to analyze their impact on the business, identify trends and make informed decisions on optimizing them for maximum ROI.
By analyzing data, you can identify any promotions made by any seller or platform on your SKUs, compare those promotions to the ones you had planned, and track whether your authorized seller has the buy box, and compare pricing and promotions across the competition, platforms, and sellers to identify trends.
Keeping track of inventory

Stockouts are the worst nightmare for any e-commerce business. The number of times a retailer has to deal with out-of-stock situations can be devastating. The situation can also be frustrating for customers who would have otherwise bought the product, but cannot because it is out of stock, and later influences them to switch to the competition brands. The deactivation or removal of products from listings is also standard among e-commerce platforms when products are not in stock and can decrease sales.
Analyzing data can be used to forecast the likelihood of an out-of-stock product. With more data, the prediction becomes more accurate. E-commerce retailers can use this knowledge can be used by e-commerce retailers to prevent stockouts of products that are likely to be out-of-stock by taking proactive measures like substituting goods or increasing manufacturing capacity.
With our in-house tool, Kinator, you can track on-shelf availability across platforms, sellers, and locations. Also, send a custom alert for each out-of-stock item with your authorized sellers, and separate out-of-stock Power SKUs.
Tracking of visibility metrics
We all know how it goes; if you are not on the top search result pages, that means no visibility, which equals sales stagnancy, and the research also posits that two-thirds of clicks come through products that appear on the first page of search results. Ideally, your action plan would be to appear at the top as a brand manager, but manually tracking your performance, your competitors’ can become a tedious task. Here’s where data can be a big boon for you.
With consolidated data from all channels, you can see how many of your SKUs show up in the Top 3, 10, or 20 search results for important search keywords, how many of your SKUs appear on Page 1, and how many are at the top of their respective categories. You can identify which competitors hold key visibility spots by tracking trends in your share of shelf over time.
E-Advertising
It is essential to track advertising metrics for several reasons. If you use the right advertising channel to attract customers, you must have a proper tracking system to measure each campaign’s success. It isn’t easy to know which campaign is doing well if you don’t track it properly. What if you stop one campaign and start another, and you didn’t track it? If your business is suffering because of that, you would not be aware of it until the next month when you compare your sales with last month, resulting in a loss of revenue.
Media assets- A combination of powerful words and pictures can make a powerful impact on your audience. Since the market is so competitive, it’s important to find an edge over others. A good banner ad can do wonders when it comes to increasing your CTR rate and, thereby, conversions.
Data analytics can help you analyze all important metrics of an advertisement on major eCommerce platforms, such as measuring KPIs against brand goals and category benchmarks, mapping stock, campaign balance, and campaign creation error, and analyzing performance at the campaign, ad type, and portfolio levels. With this, you can brainstorm and make a data-backed decision to increase maximum ROI on your campaign’s expenditure.
Market Basket Analysis
Retailers use the Market Basket Analysis technique to understand the products that are often purchased together. Data analytics helps them identify which items can be promoted as “package deals” or “bundles,” it also can be referred to as association analysis, which is an analysis of the association rules that exist between two or more purchase events.
Let’s take an example to understand better; suppose you found out that one of your SKUs is slow-moving (e.g., toothbrush) and not bringing you sales, but according to the trend pattern, you bundled that product with a fast-moving product (shaving cream). This can help you increase your conversion rate as well as move up your inventory.
Let’s dive deeper, shall we: Creating a basket of complementary products, such as the ones that go together, but aren’t similar. (Oil & flour). These interesting combinations can be found through analytics by identifying the shopping pattern. This unexpected combination falls under the umbrella term of data mining which uncovers meaningful correlation between different products according to their co-occurrence in a data set. Which we talked about, called affinity or market basket analysis.
Regression analysis
Regression analysis helps to understand the association between the dependent and independent variable(s). It helps you in identifying patterns and relationships over a period of time. For example, regression analysis can help you determine how much sales are influenced by the marketing budget.
Regression analysis will benefit businesses that rely on repeat customers, and eCommerce is such a business.
In e-commerce, regression analysis is used to understand the impact of various independent variables(Stock, price, and visibility) on the dependent variable (sales). By identifying the relationship between independent and dependent variables in advance, you can predict future sales. For example, if you offer discounts or cashback on a specific product category, knowing which category will get maximum traction can help you serve more customers and increase the conversion rate.
Another example for easier understanding is if a brand manager has chosen to increase product visibility as a marketing strategy, then regression analysis will help evaluate the impact this decision has on sales volumes. Because visibility is an independent variable and sales is a dependent variable on it.
Best Seller Share tracking
Amazon bestseller comes in the orange-like ribbon shape, and you can see that on the product detail page itself, it works on category level and not on the product level; when you have this badge, it means that your product is selling the most in that category. Since best seller rank is updated on an hourly basis, there are certain things you need to keep constant track of, such as;
- Keep on updating your product content with relevant keywords
- Maintain your Amazon account health
- Inventory management
- Creating attractive media campaigns
- Maintain a good set of customer reviews
All these areas need constant tracking, along with tracking your competitors’; it also provides data on how many days you are holding the top spot in a particular category, your overall rank, and much more helpful information. And while we all know how BSR directly impacts sales velocity, identifying these metrics will be a boon for you to stay on top and sustain your position for the long run.

How Paxcom’s Channel Intelligence Solution Can Help?
The company’s channel intelligence tool, Kinator, combines any available data into a very visual and interactive format to help brands make sound and strategic decisions. A customized dashboard that is accessible anytime, anywhere, features the ability to filter by Channel, Category, Brand, Focus SKU, Timeframe, City, and more. You get access to high-end information about the consumer’s behavior, and you can then tailor your marketing and sales strategies to meet their needs, resulting in increased sales.
Conclusion
With the endless array of data available to every brand in the e-commerce ecosystem, they must analyze the data, create meaningful, actionable insights, and start working towards implementing actionable plans to grow their businesses. For more information, you can connect with our experts at info@paxcom.net.